Analyzing the Front Three (Part 2, Game Scores)
Lifting once again from the free passages of www.billjamesonline.net, I was impressed by a Jamesian argument for the inclusion of Bert Blyleven based upon his compiled Game Scores. Game Scores, invented by James himself, is a measuring stick of a pitcher's performance on any given day. According to BR Bullpen Wiki, Dean Chance holds the all-time highest game score at 116 (1964), which he accomplished this by throwing 14 shut out innings with 12 strikeouts and surrendering only 3 hits. Conversely, Mike Oquist threw the worst recorded Game Score of -29 in 1998 in a contest where he gave up 14 earned runs in 5 innings. James figures that if you achieve a Game Score 50 or above, you have a better chance of helping your team winning while if you throw a Game Score below 50 you are hurting your team's chances of victory.
The world-renown sabrmatician attempted to find resolution to the argument that Bert Blyleven had pitched much better than his career .534 winning percentage would incinuate, aside from simply saying 'because'. Upon examination of the numbers, James saw that Bert was the recipiant an inordinate amount of "tough losses", a loss recieved despite throwing a Game Score above 50, indicating that he was indeed a hard-luck Dutchman.
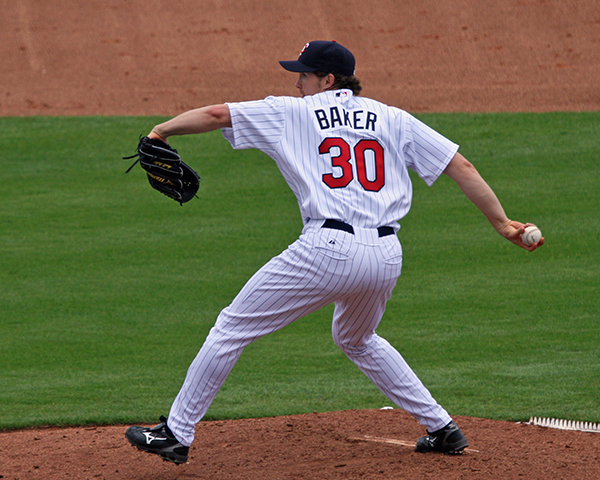
Scott Baker - 9-9 (4-1 in no-decisions)
- GS > 50: 5-3 (2-0)
- GS < 50: 4-6 (2-2)
This analysis persuaded me to inspect the numbers of the Twins front line starters, beginning with Scott Baker. Had Johan Santana not masterfully carved up the Texas Ranger offense on August 19th of last year, a performance that resulted in a Game Score of 95, Baker would have held the title for "Highest Twins Game Score" after his August 31st match-up against the Kansas City Royals where he earned a Game Score of 93. Baker, the headliner in only 23 games in 2007, accrued a record of 9-9 but assisted the Twins in more victories (4-1) in games he did not recieve the decision. Of his 9 wins, Baker had 5 games in which his Game Score was above 50. This means he had 3 games in which his offense or defense lifted him into the win column (or what Bill James refers to as a "cheap win"). His "luckiest" game came on July 6th in the first game of a doubleheader against the White Sox in which he gave up 7 earned runs in just 5 innings (a Game Score of 26) but still was named the winner when the offense supported him with 20 runs. In his 9 losses, Baker tossed 4 games above a Game Score of 50 but was credited the loss when the Twins bats went silent. In just one outing prior to that aforementioned "cheap win", Baker faced the 2nd place Tigers on July 1st at Comerica and matched Jeremy Bonderman for 7 scoreless innings. That is, until Marcus Thames hit a solo home run to left in the bottom of the 8th. Baker struck out 7 in 8 innings, a Game Score of 76 but was tagged with the loss when the Twins failed to score any runs. Bonderman had a Game Score of 74.
| GS > 90 | GS 80-89 | GS 70-79 | GS 60-69 | GS < 40 |
| 1 | 1 | 3 | 1 | 8 |
Another critical part of this study is that when you look at the breakdown of Scott Baker's numbers, his 2007 season was often statistically polar opposites. In 6 of his starts, Baker dazzled and provided a glimpse of the dominating prospect the front office expected, completing those games with Game Scores of 60 or above. 5 of those games he finished 70 or higher. Unfortunately in 8 of his 23 starts, Baker's Game Score was 40 or lower, bottoming out on May 30th with a Game Score of 17 in a 10 hit, 6 earned run tromping by the White Sox in only three innings.
When the media or coaching staff says that Scott Baker has the ability to be the staff ace, they undoubtedly mean it. Baker, however, has to prove that he has learned from those 8 games in which he failed to keep his team in victory's reach.

Boof Bonser - 8-12 (6-4 in no-decisions)
- GS > 50: 5-3 (5-2)
- GS < 50: 3-9 (1-2)
Boof had a very forgettable sophomore season in the Twins rotation. In his first season with the Twins, Bonser was one of several who produced as a starter as Brad Radke struggled to remain healthy. Bonser inspired enough confidence to be named the game two starter against the Oakland Athletics in the ALDS (mostly because of lack of Radke and Liriano, but still). The Boof finished 6 strong innings while relinquishing 2 earned runs and strikeout three. He left with a Game Score of 52 and the game tied 2 to 2. He, along with 55,710 other Dome attendees, watched in horror as Dennys Reyes gave up a dying liner to center off of the bat of Mark Kotsay that made its way past the diving Torii Hunter to the blue tarp in deep center as Jason Kendall and Kotsay raced around the bases for an inside the park home run. The Twins front office had enough faith that in his small showing on the big stage that Bonser would be a good compliment to Johan Santana in 2007. Bonser failed to emerge as that candidate. Consistancy was a constant problem with Bonser in 2007. Yes, he had 3 tough losses but nothing as spectacular as Baker's Game Score of 76 against the Tigers. In fact, Bonser's best Game Score was 77, one better than Baker but it was obvious that the right-hander peaked in mid-May. After starting 1-1 in his first 8 starts of the year, Bonser worked the Milwaukee Brewers on May 18th in front of 44,759 paying customers at Miller Park (a good number of them Twins fans on that Friday night). He struck out 11 in 7 innings and gave up just one run. Bonser never had an outing as bad as Baker's Game Score of 17 against the White Sox, but he did produce Game Scores of 21 on three seperate occasions - the most embarassing coming on September 2nd where Bonser did not make it out of the 2nd inning against a weak Kansas City lineup. Bonser, for the most part, tossed very mediocre games. He gave his team the opportunity to win but was frequently shelled just as well.
| GS > 90 | GS 80-89 | GS 70-79 | GS 60-69 | GS < 40 |
| 0 | 0 | 1 | 4 | 8 |
Evidence that Bonser does not come equipt with overwhelming stuff, or at least fails to employ it, as Baker did in 2007. While successful at giving his team opportunity to win in 5 of his 30 starts (16%), on the other hand he was a liability to the team in 8 (26%). The other 58% of his starts Bonser was just good enough to to hope the team would provide him with enough run support, which they often did not (4.16). Both Bonser's third season and an improved offensive would greatly assist in raising his winning percentage.
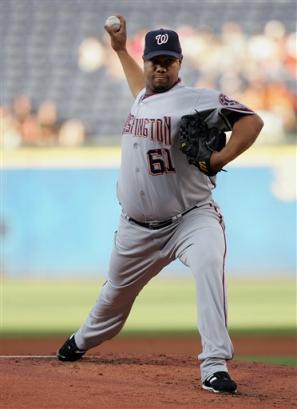
Livan Hernandez - 11-11 (5-6 in no-decisions)
- GS > 50: 7-1 (1-5)
- GS < 50: 4-10 (4-1)
A diminishing talent (read: older than 33) with a crafty approach (read: 84-mph fastball), Hernandez did what everybody expected him to do: finished .500. (A more astute analyst would say that he was actually a .484 pitcher considering the Diamondback's record was 16-17 in games he started but for the benefit of those who continue to drink the kool-aid, we will label him a ".500 pitcher") Livan, as a pitcher, was thrillingly unspectacular in 2007. Never once did he finish with a Game Score higher than 67 but three times he finished with Game Scores 12 or lower. His wins are pretty consistant. If he was able to pitch good enough to keep his Game Score in the 60s, the offense came through with 4.4 runs on average for Hernandez. He was only cheated out of one game in August, where the Padres at PETCO tagged him for only two runs in 6 innings but the Diamondbacks failed to muster any runs of the always dominate Jake Peavy. Peavy, who struck out 11 D'Backs that game, produced a Game Score of 75. Twice Hernandez was the victim of Jose Valverde's blown saves (both instances to NL Champion Colorado Rockies) after pitching Game Scores of 60 or better. Judging by his Game Score division above, however, he was the recipiant of 4 victories that could have easily have been loses. His May 12th game in Houston where he lasted only 4 innings and was tattooed for 8 runs on 11 hits and 2 home runs (Mike Lamb was one of them) resulted in a Game Score of 10. What Hernandez brings to the mound is the feeling that he will not get cheated. When he is missing his spots, it can be worse than fuel on fire. Fuel mixed with napalm on fire. His crafty approach (read: mixes 64 mph curveballs) can keep a lineup off balance enough at times to allow his offense to generate runs and his bullpen to hopefully secure the victory.
| GS > 90 | GS 80-89 | GS 70-79 | GS 60-69 | GS < 40 |
| 0 | 0 | 0 | 7 | 9 |
As mentioned before, Hernandez is a pitcher that tries to get through 6 or 7 innings at which point he hopes that he has not surrendered enough runs to put the game out of reach for his team. In 7 of his 33 starts he gave his team a better than average opportunity to win. 9 times Hernandez took the mound and failed to give his team the chance to win (3 of which were unmitigated disasters of FEMA emergency proportions). This leaves 17 appearances in which Hernandez took the mound and gave his team a 50-50 chance of winning. He would give up 4+ runs but would hope that his offense would match. He leaves little margin of error for his team.